The Elastic Stack is a simple way to log “things” into ElasticSearch and make them nicely visible via Kibana. Since ELK can handle logs as well as time series data, I’ll use it for my own logging incl. performance logging.
For pure time series data I’d use the TIG stack: Telegraf, InfluxDB and Grafana.
Installing
sudo sysctl vm.max_map_count=262144
mkdir elk
cd elk
cat >docker-compose.yaml <<_EOF_
version: '3'
services:
  elk:
    restart: always
    container_name: elk
    image: sebp/elk
    environment:
      - LOGSTASH_START=0
      - TZ=Asia/Tokyo
    ports:
      - "5601:5601"
      - "9200:9200"
      - "5044:5044"
    volumes:
      - "./data:/var/lib/elasticsearch"
_EOF_
mkdir -m 0755 data
sudo chown 991:991 data
docker-compose up -d
Starting takes a minute. It’s up when the Kibana web interface is reachable.
Reference: elk-docker
Using Kibana
Connect to http://the.docker.host:5601/ to get the Kibana interface. Click on the Dev Tools icon to create a new index:
PUT /logs
{
  "settings": {
  "number_of_shards": 1
  },
  "mappings": {
    "properties": {
      "timestamp": { "type": "date" },
      "status": { "type": "integer" },
      "msg": { "type": "text" }
    }
  }
}
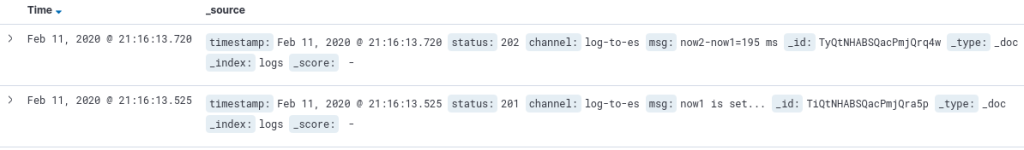
To see that there’s something inside the index:
GET /logs/_search
To put something into the index:
POST /logs/_doc
{
  "timestamp": "2020-02-02T15:15:18+09:00",
  "status": 201,
  "msg": "Not so difficult, is it?"
}
And did you know you can use SQL statements for ElasticSearch too?
POST /_sql?format=txt
{
  "query": """
    SELECT * FROM logs WHERE timestamp IS NOT NULL ORDER BY timestamp DESC LIMIT 5
  """
}
Sending Logs
Via curl:
curl -H "Content-Type: application/json" -X POST "http://the.docker.host:9200/logs/_doc" -d '{ "timestamp": "'$(date --iso-8601="sec")'", "status": 200, "msg": "Testing from curl" }'
Via Node.js:
const { Client } = require('@elastic/elasticsearch');
const client = new Client({ node: 'http://your.docker.host:9200' });

async function run () {
  let now = new Date();
  try {
    await client.index({
      index: 'logs',
      body: {
        timestamp: now.toISOString(),
        status: 200,
        msg: 'Testing from Node.js'
      }
    })
  } catch (err) {
    console.error("Error: ", err);
}

run().catch(console.log)
Security?
Until here there’s no security. Nothing at all. Anyone can connect to ElasticSearch and execute commands to add data or delete indices. Anyone can login to Kibana and look at data. Not good.
This describes how to set up security. Here you got the explanation for the permissions you can give to roles.
I created a role ‘logswriter’ which has the permissions for ‘create_doc’ for the index ‘logs*’. Then a user ‘logger’ with above role. Now I can log via that user. In Node.js this looks like:
const client = new Client({
  node: 'http://the.docker.host:9200',
  auth: {
    username: 'logger',
    password: 'PASSWORD'
  }
});
the rest is unchanged. Via fetch API it’s simple too:
try {
  fetch('http://logger:PASSWORD@the.docker.host:9200/logs/_doc', {
    method: 'post',
    body: JSON.stringify({
      timestamp: now.toISOString(),
      status: 206,
      msg: 'Fetch did this')
    }),
    headers: { 'Content-Type': 'application/json' },
  })
} catch(err) {
  console.error('Error: ', ${err});
}
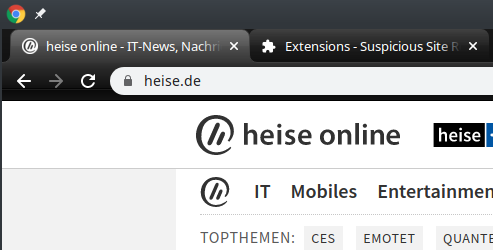
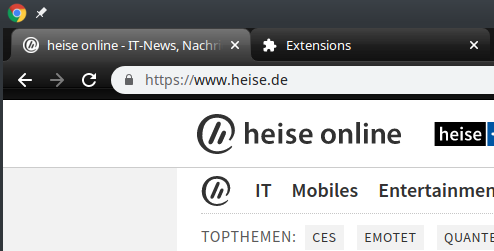
Note that while the username and password can come from an environment variable so it’s not in in the source code, the transport protocol is still unencrypted http.
To be continued. To make the use of https necessary, I have to deploy this on the Internet first.